|
With Summer over and Winter right around the corner, the Guys of LIDAR wanted one last test event to wrap up the year. Since we like to focus on cutting edge performance, we decided to test high-end radar detectors.  Radar detectors have been tested on all kinds of courses, from straight, flat courses to complex courses with hills and curves. But, real-world results can vary. A lot. Every radar encounter is different. No matter how many different courses are used for testing, no test can show you exactly what will happen when you drive down the street with a certain detector in your vehicle. The bottom line that everyone wants to know is: Which detector is the most sensitive? Our tests were set up to try and answer that question. 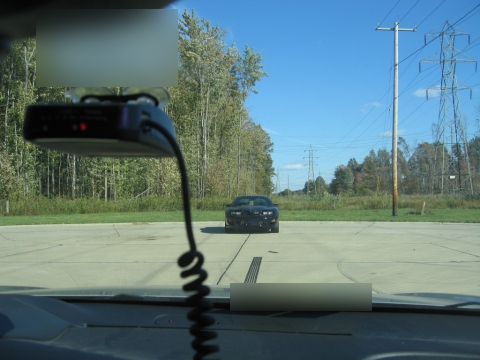 We tested the following detectors:
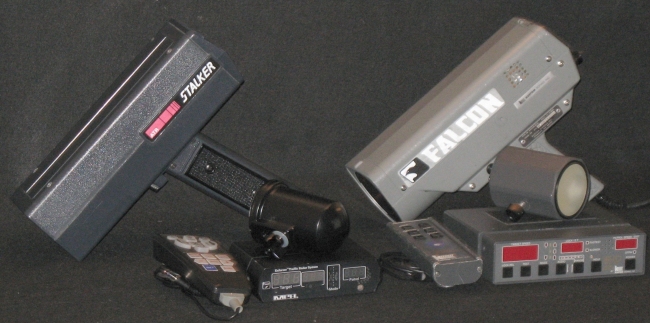 We used the following radar units:
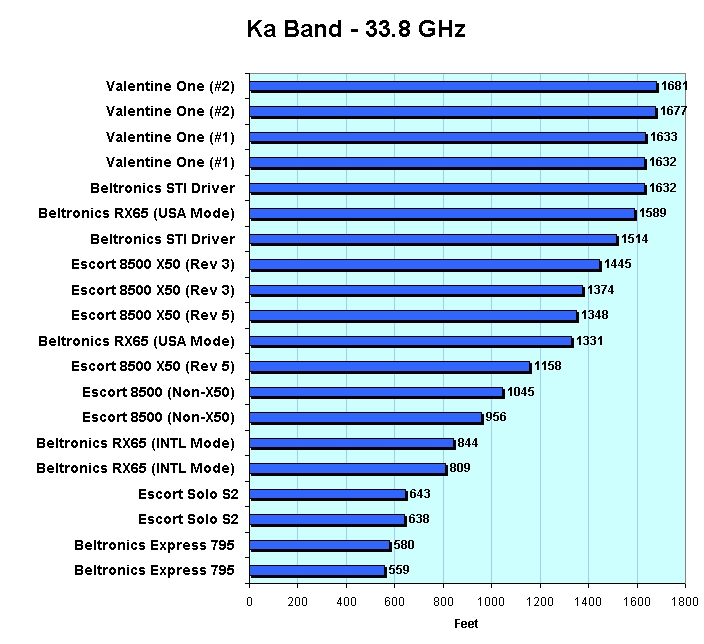
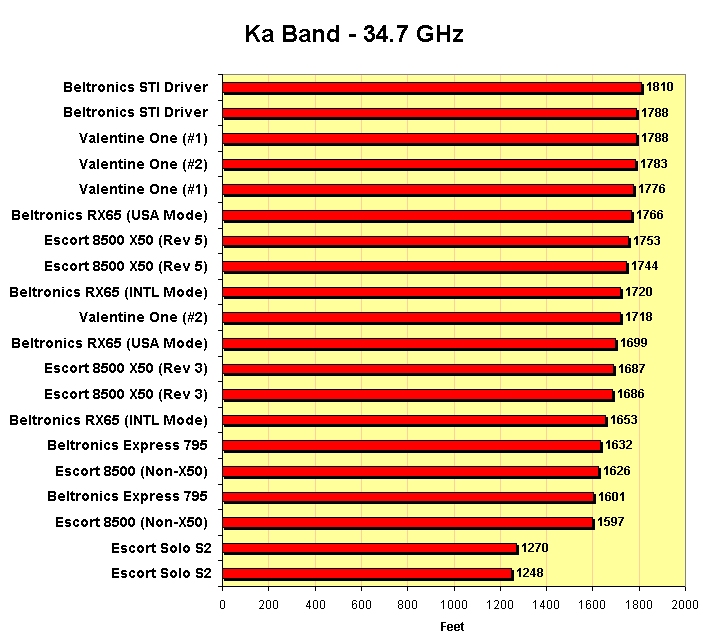
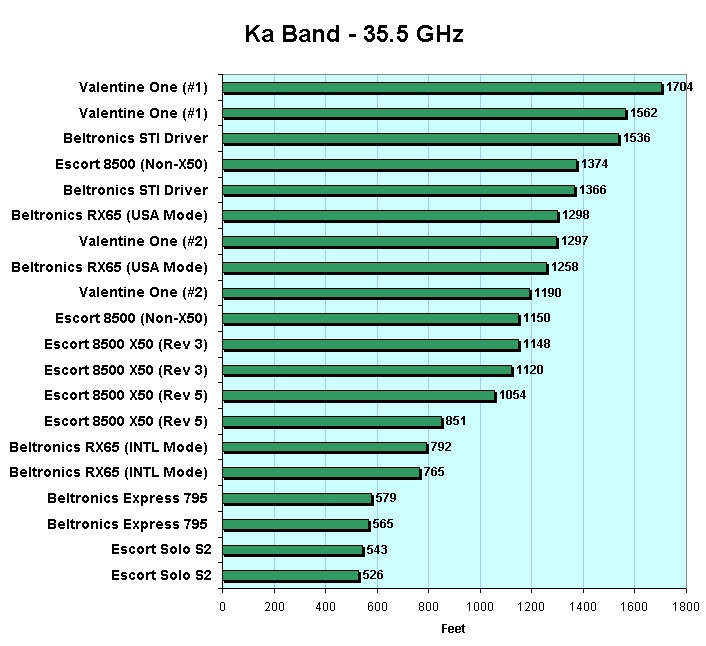
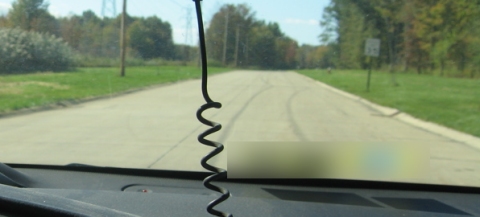 The Guys of LIDAR are always trying to find better ways to test countermeasures. One difficulty to overcome when testing radar detectors comes from the high sensitivity: many of today's high-end radar detectors can detect a radar source a number of miles away, if there is line-of-sight between the radar source and the detector. For this test, we decided to try something new. A special box was constructed using microwave absorbent foam. The radar guns were operated from inside the box, and aimed straight down the test course. The box greatly reduced the signal from the radar guns, leaving only a weak signal for the detectors to sniff out. This shortened detection distance to a practical length that could easily be measured with a laser gun. For this test, we went back to out laser test course that we have used in recent tests, which is a 2000+ foot straight stretch at a dead-end road. We tested the detectors on the three main USA Ka frequencies, as well as K-Band.
Test Details:
Please remember: This test is NOT real world. What cop uses radar absorbent foam to reduce the radar signal? What these test results provide, is an indication of "relative sensitivity", or how the detectors might compare against each other. The absolute distances mean nothing in the real world, for example these test results do not mean that "Detector A can only detect radar 100 feet away" or that "Detector A is only 100 feet better than Detector B". There is also no way to tell from this test that "radar gun A is hard to detect and radar gun B is easy to detect". An interesting note: With some detectors, we experienced a high degree of repeatability from the first to second run: they were within feet of each other. We hope to develop this method further for use in future testing.    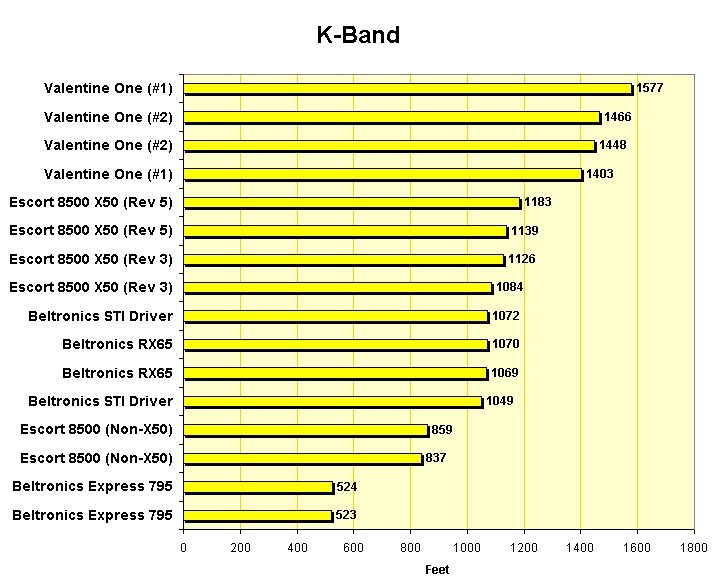 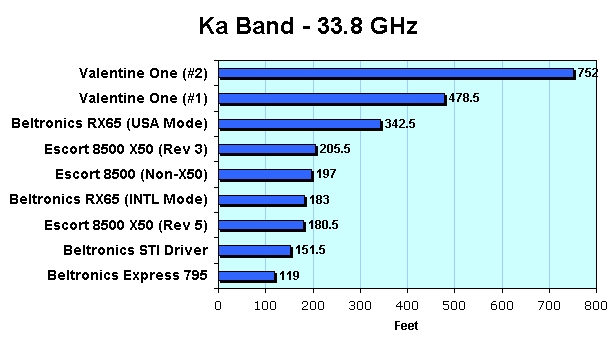 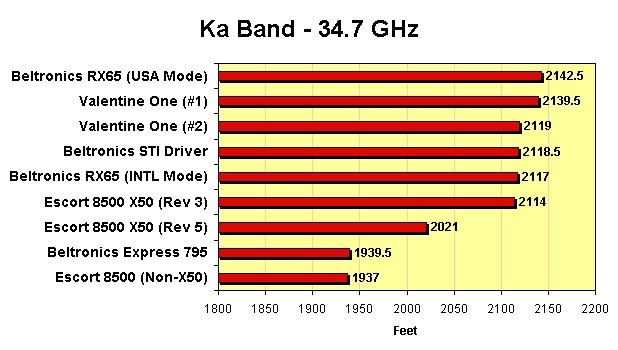 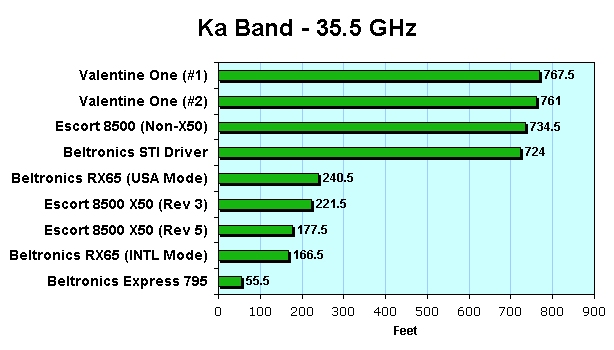 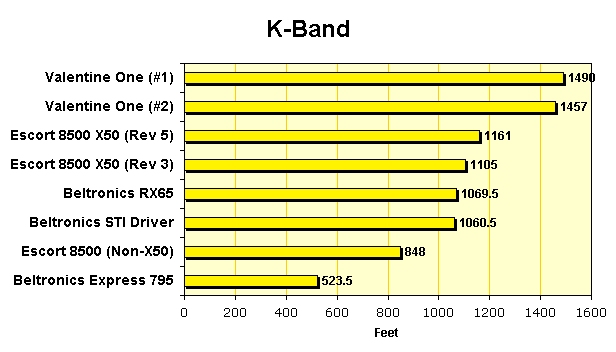 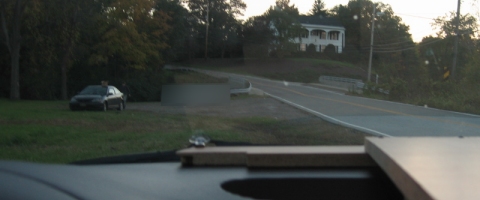 An over-the-hill test is widely regarded as the best real-world style test for comparing the sensitivity of different detectors. The reason is simple: very little radar makes it over the hill. This leaves a very weak signal for the detectors to sniff out, effectively shortening the test course to a length that is practical. Although we looked around for another test course, we ultimately decided to go back to the test course we used in August 2005, which provided a hill and a small curve. Testing at this location presented some unique challenges, such as suspicious neighbors yelling at us to leave, a deep curb that has flattened a tire in the past, and occasional traffic on the test course. This location had some bad vibes, to say the least. But we stuck it out, and tested the detectors on the three main USA Ka frequencies, which is something we always regretted not having time to do back in our 2005 test. Test Details:
   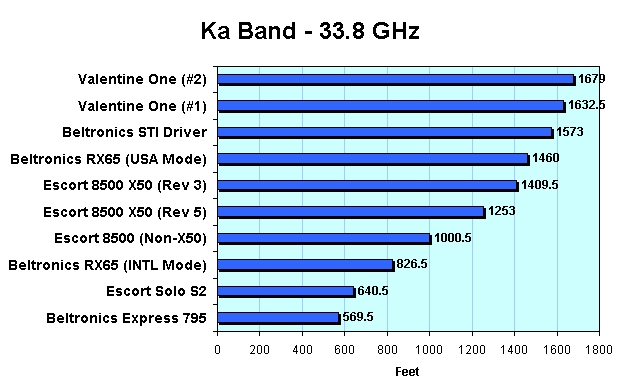   We decided to try testing POP detection over the hill, using the MPH Enforcer (67ms Ka POP). We positioned the test vehicle at a point 1190 feet from the radar source, and gave each detector three hits of POP.
|